Uncertainty remains strong in the cryptocurrency market this week, with Bitcoin once again down 3% over the last seven days, trading at around €7600 ($8,300) on October 2. Altcoins remain correlated and no assets currently stand out in the market. Among the large caps, only XRP is slightly more resilient and regains 4.20% over a week.
The market is therefore in doubt and pessimistic messages are once again flourishing on social networks. However, we believe that current price levels are buying opportunities that could be favourable in the medium to long term. On Bitcoin, the 7400€ (8000$) area seems to resist, and the support just below 6700€ (7500$) should also be strong. Is this a good time to buy Bitcoin? Here are some arguments.
According to CoinMarketCap, market capitalisation is bouncing very slightly to $220 billion from $217 billion last week. Bitcoin’s share of the total market capitalisation remains around 67.7%, which makes reading this market complex. Some information to note this week:
Ethereum suffers less than Bitcoin and holds its support around 160€ (175$)
Tether (USDT) becomes the 4th largest market capitalisation with more than $4 billion, ahead of Bitcoin Cash (BCH).
The Hashrate (the hash power on the Bitcoin network) is back to its historical highs and seems to be a sign of miners’ confidence.
We invite you to discover our complete analysis in video (in french):
Bitcoin (BTC)
Coinhouse recommendation: Buy on support
Our recommendation this week on Bitcoin should be considered in light of your risk aversion. Here are the price zones to intervene in according to your investor profile:
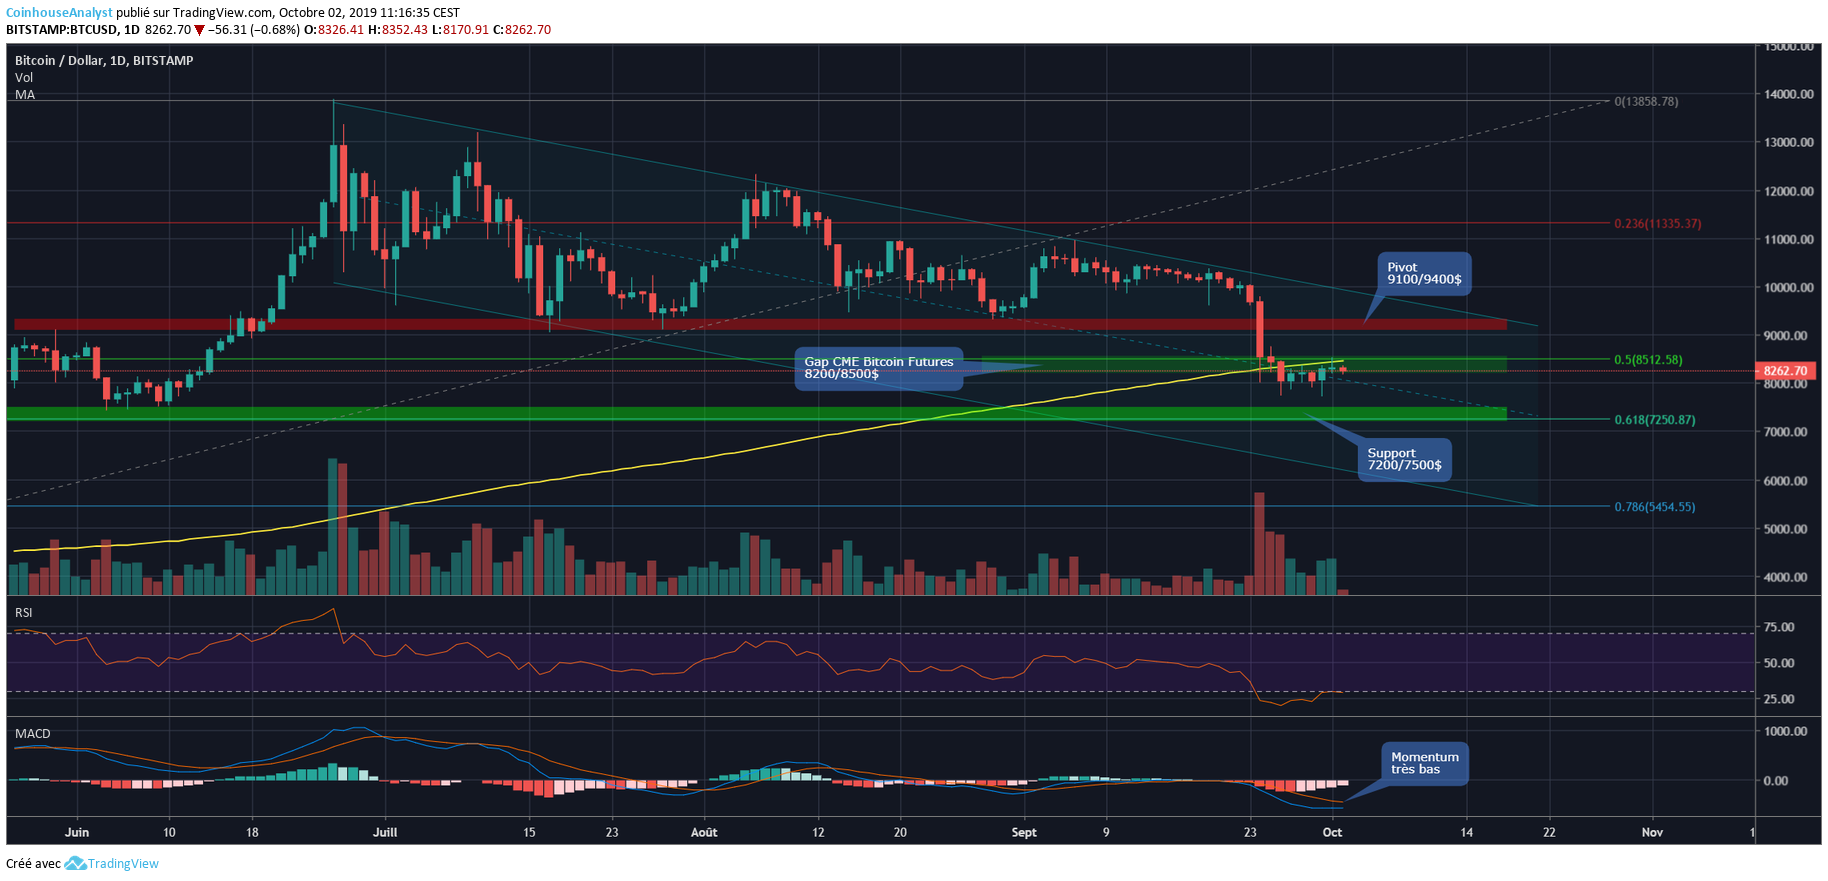
First of all, for those who have a low-risk profile, better to wait. Since the break of the consolidation figure and the support of the €8200 to €8400 ($9100 to 9400$), the situation is not very positive. You would prefer to wait for the buyers to regain control. A bullish break above the €8400 ($9400) level with volumes will be a buy signal to take new positions in the market again.
For those with a more aggressive profile, buyings were possible last week during the drop towards the price level between €7550 and €7800 ($8200 and $8500), corresponding to the daily gap on the CME Bitcoin Futures contract. However, this decline has led the chart below the 200-day moving average (the yellow line on the chart), which usually supports the price of Bitcoin during bull markets. Currently located around €7700 ($8400), a break above this moving average would give a first buy signal.
If the price drops again and comes to the support between €6550 and €6800 ($7200 and $7500), some new buyings will be considered. However, it will be necessary to monitor the strenght of this support and the volumes.
In any case, a clear bear break under €6550 ($7200) with volumes will be a sell signal. The bull market sentiment will then be questioned and a more detailed analysis abour the next potential supports will then be necessary.
Ethereum (ETH)
Coinhouse recommendation: Buy
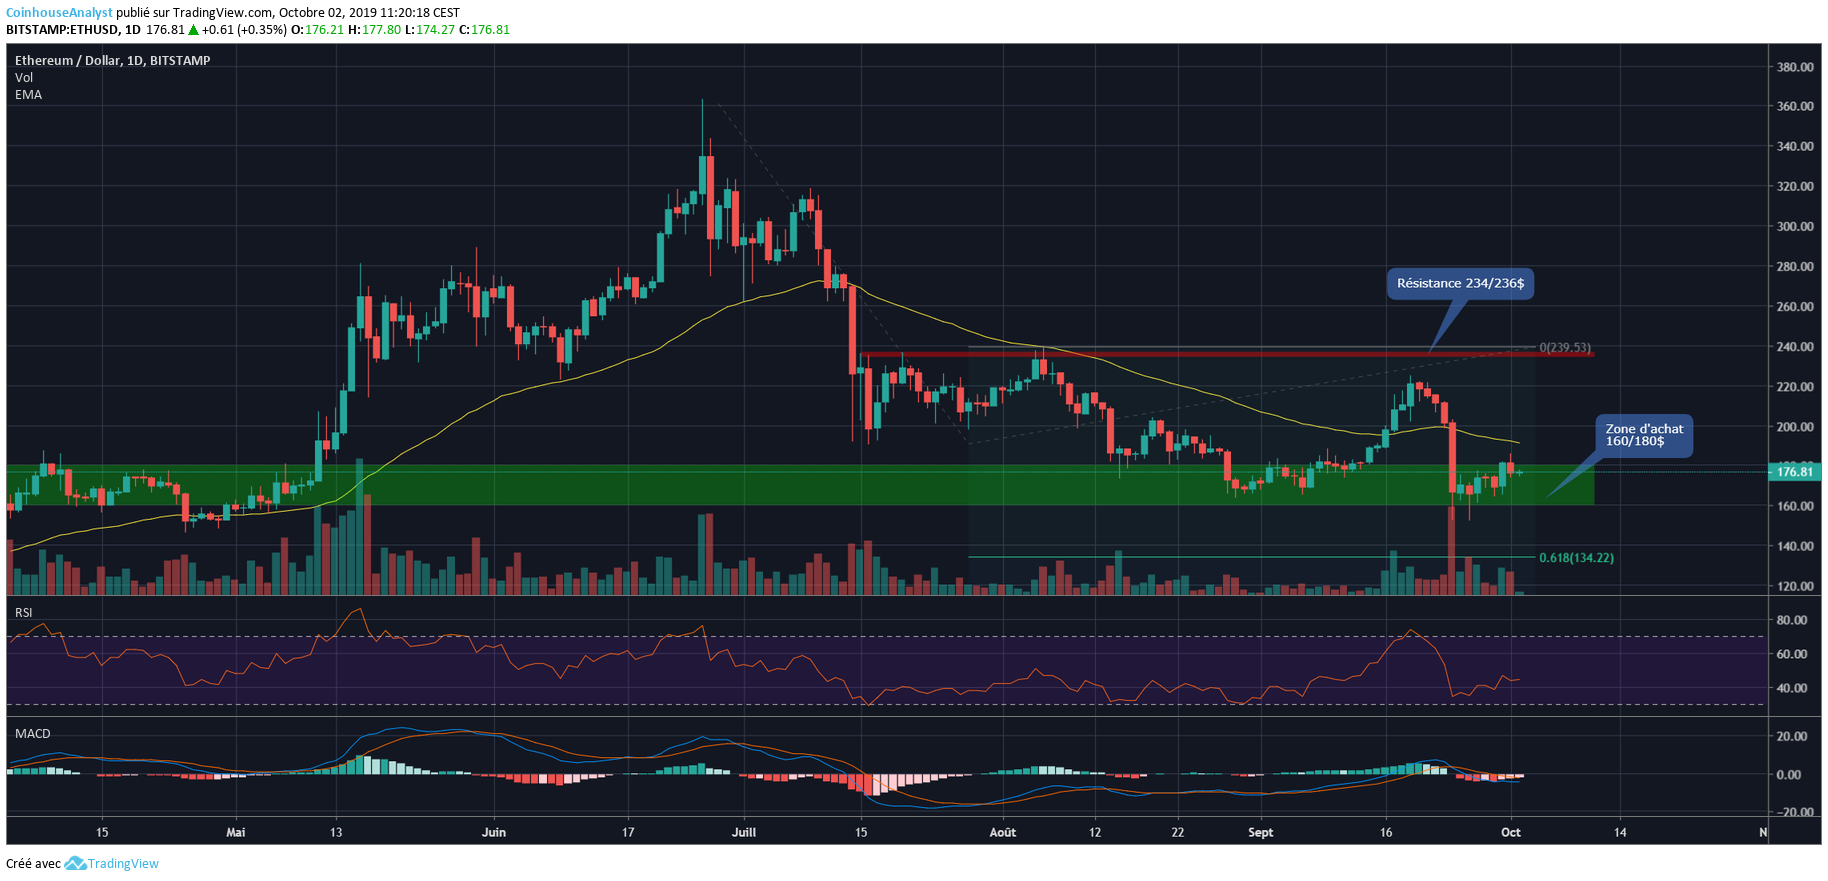
Ethereum récupère un peu cette semaine et regagne 3,40% en sept jours, pour coter à 163€ (177$) ce 2 octobre. Même si la baisse du 24 était impressionnante, elle s’est encore arrêtée net sur la zone des 145€ à 160€(160$ à 180$). Le cours n’est passé que très temporairement sous les 160$ et il n’y a pas eu de clôture journalière sous ce niveau. Cette zone reste donc pour nous propice pour des achats et de l’accumulation d’ethers dans une optique moyen long-terme. Il faut toujours franchir l’ancienne résistance des 212€ (236$) pour confirmer une reprise haussière plus long-terme, et une cassure baissière franche des 160$ avec des volumes resterait un signal de vente.
Ethereum recovers a little this week with +3.40% in seven days, trading at €163 ($177) on October 2. Even if the last week drop was impressive, the chart stays above the €145 to €160 zone ($160 to $180). The price dropped temporarily below $160 but there was no daily close below that level. So this price level remains interesting to buy to accumulate some ethers in a medium-to-long-term perspective. But we need to break up the resistance at €212 ($236) to confirm a longer-term bullish recovery. A bear break of $160 with volumes would remain a sell signal.
Cosmos (ATOM)
Coinhouse recommendation: Hold
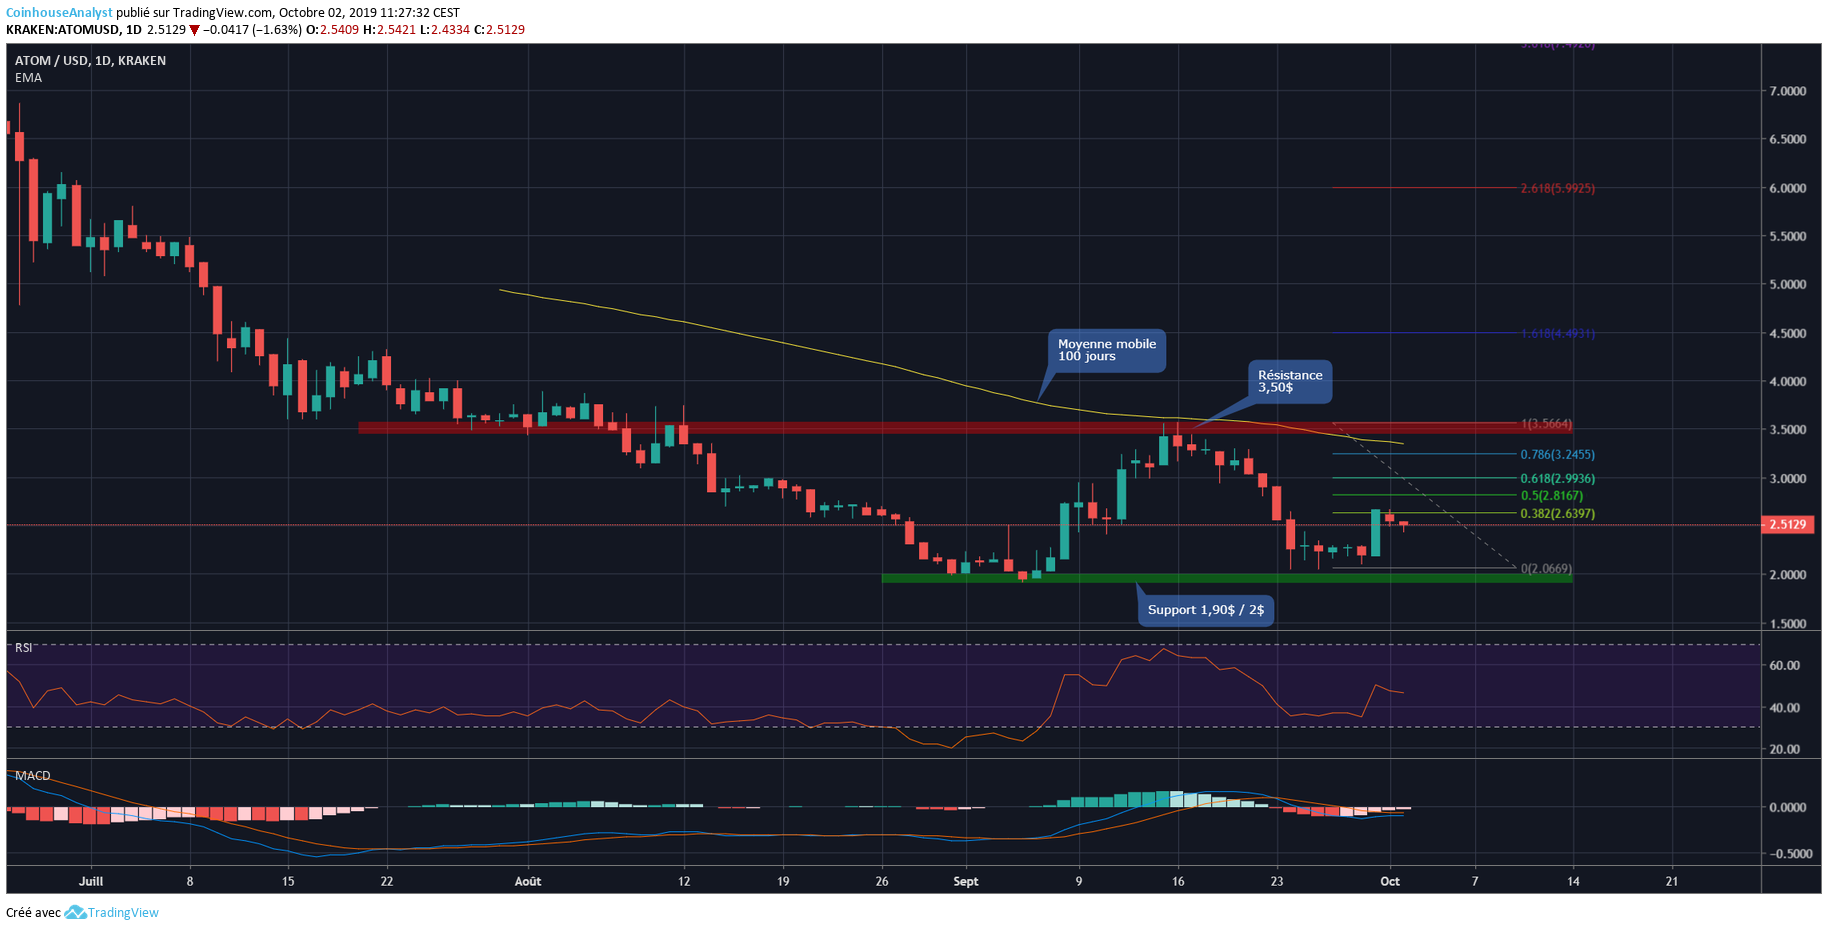
Looking back at the ATOM token, which offers this week a nice 10% bounce, trading at €2.30 ($2.50). The interesting technical pattern on ATOM is that the asset seems to have found a solid support around €1.80 ($2), through a double-bottom pattern, in early then late September.
This support interesting to buy. For those who already have some ATOMs, it is now holding time, because the price is located between this support and the resistance of €3.20 ($3.50). We also notice that the 100-day moving average was merged with this resistance during mid-September and rejected the price. A break above this moving average would be a first buy signal on ATOM. However, the confirmation of a longer-term bullish reversal will be the price to break the resistance at €3.20 ($3.50). Another signalto signal to strengthen purchases. Only a clear bear break below the €1.70 ($1.90) level will be a sell signal
Falls of more than 10% in less than 24 hours like last week’s are a consequence of the small size of the market. While crypto assets are gaining traction, these violent drops are becoming increasingly rare. The fundamental indicators, on the other hand, are at their All Time High.
The Bakkt platform only achieved 71 bitcoins of volume on opening day. It manages to total an exchange amount of $5M over its first week. These disappointing figures indicate some wait-and-see attitude among accredited investors.
Investors’ attention is drawn to the fact that the content of the articles does not constitute financial advice. Investing in cryptoassets involves a risk of total capital loss. For more information, please do not hesitate to contact our support.
Banks and Institutions Tesla considers accepting Bitcoin as payment for cars again Elon Musk’s firm Tesla is likely to start accepting Bitcoin again in exchange for its products and services, the electric car company indicated on Monday. Tesla had suspended cryptocurrency transactions in May citing environmental concerns. A quote in a quarterly report says the […]
Bitcoin’s price has been on a spectacular uptrend for the past week. The crypto asset is up 32% over seven days and is trading around the €33,500 ($40,000) mark on 28 July. Buyers have clearly regained control, particularly following a sudden price movement on the night of 25 to 26 July, which we return to […]
Bitcoin bends but does not break. That could be the adage of the last fortnight in the cryptocurrency market. However, the technical situation remains poorly oriented, with sellers dominating since the beginning of July. Bitcoin is down 5% in a week and is hovering around €26,300 ($31,000) on July 21. On July 20, the price […]
Bitcoin’s price is not picking up any particular strength at the beginning of the summer. On the contrary, volatility is at its lowest point in the year 2021. The king of cryptocurrencies is near-stable on a week, down slightly by 2.9% and trading around €29,000 ($35,000) this July 7. The long-term trend is still bullish […]
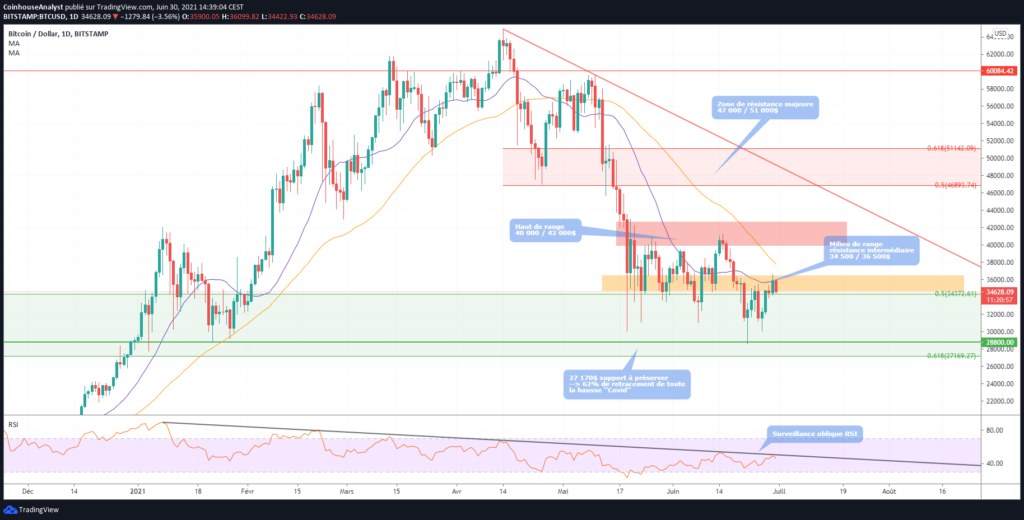
After the sudden drop suffered by the cryptocurrency market on May 19, June is ending with a majority of investors left wanting more. With a slight variation of -7% over a month, Bitcoin is trading around €29,000 ($35,000) this June 30. The last few weeks have been dominated by fear and doubt, with China’s repressive […]
We are once again witnessing a surprising week in the cryptocurrency market. After several days of decline, Bitcoin seemed to lose the important support of €25,000 ($30,000) on the afternoon of June 22. But that was without counting on the reaction of buyers who quickly pushed the price back above $30,000. After this price action, […]
The situation is easing in the cryptocurrency market. Bitcoin has been rebounding nicely over the past week, rising nearly 20% in seven days to trade around €33,200 ($40,000) on June 16. However, we will see in the detailed technical analysis that the price has returned to a key level, with the $42,000 (€34,600) resistance to […]
A wind of panic blew again at the beginning of the week on the cryptocurrency market. Negative news stories have multiplied, contributing to undermining investor sentiment. Yet Bitcoin remains in its range between €24,500 and €32,7000 ($30,000 and $40,000) and is trading this June 10 around €30,800 ($37,000). There is no doubt that the $30,000 […]
After the purge of May, the last few days are plunging the cryptocurrency market into a very indecisive situation. Bitcoin is down about 3% in a week to around €30,500 ($37,000) on June 2. What to remember: Bitcoin’s price has actually been hovering between €24,500 and €32,7000 ($30,000 and $40,000) since May 19. Technically, a […]
Investing in crypto-assets carries risks of liquidity, volatility, and partial or total capital loss. Crypto-assets held are not covered by deposit and securities guarantee mechanisms.
Coinhouse SAS with a capital of €210,000, RCS Paris 815 254 545, headquarters: 14 Avenue de l'Opéra 75001 Paris – support@coinhouse.com. Registered with the AMF for activities related to the purchase/sale of digital assets against legal tender, the exchange of digital assets for other digital assets, and the custody of digital assets for third parties under the registration number: E2020-001.
Coinhouse payment solutions
Company registered with the Paris RCS under the number 914 384 557, registered with the Prudential Control and Resolution Authority as a payment service agent under the number 727503 of the electronic money institution Treezor, headquartered at 33 Avenue de Wagram, 75017 Paris.
General conditions, disclaimers and legal documents.